PrimeXBT: Is this the start of a Bitcoin bull run? A 2022 signal appeared before the rally

A weekly momentum divergence formed on the Bitcoin chart ahead of last week’s advance, and the daily reading has since made a move last seen in January 2023. By Jonatan Randin – Senior Market Analyst at PrimeXBT Bitcoin (BTC) ran from around $64,000 to just under $80,000 inside four sessions last week. The explanations offered have mostly been the obvious ones. On 19 August the US Treasury said it would at least double the maximum size of its long-end liquidity support buyback operations, from $2 billion to at least $4 billion per operation, covering 10 to 20 year and 20 to 30 year securities and running from 9 September through 4 November. Long-dated yields fell. Trump met crypto executives at the White House. The SEC had published its Regulation Crypto Assets proposal the day before. All of that is real, and all of it landed inside the same handful of sessions. The weekly chart, though, had been building toward something for months before any of it. The divergence Through the first half of 2026, Bitcoin kept making lower lows. The Relative Strength Index (RSI) did not follow. It made higher lows instead. RSI tracks the momentum behind a move rather than the move itself, so a gap of that kind can indicate selling pressure draining away while price is still technically falling. Traders call it a bullish divergence. On a 15-minute chart these are everywhere and mean very little. On the weekly, where each candle covers a full seven days of trading, they turn up rarely. The last one that looked like this ran through the second half of 2022, into the bear market low. Bitcoin (BTC/USD) weekly, log scale, with RSI.
Key Takeaways
- A weekly momentum divergence formed on the Bitcoin chart ahead of last week’s advance, and the daily reading has since made a move last seen in January 2023.
- By Jonatan Randin – Senior Market Analyst at PrimeXBT Bitcoin (BTC) ran from around $64,000 to just under $80,000 inside four sessions last week.
- The explanations offered have mostly been the obvious ones.
Summary generated by IndiCrypto from NewsBTC. IndiCrypto is a news aggregator and does not provide investment advice. Read the original article for full context.
More in Regulation
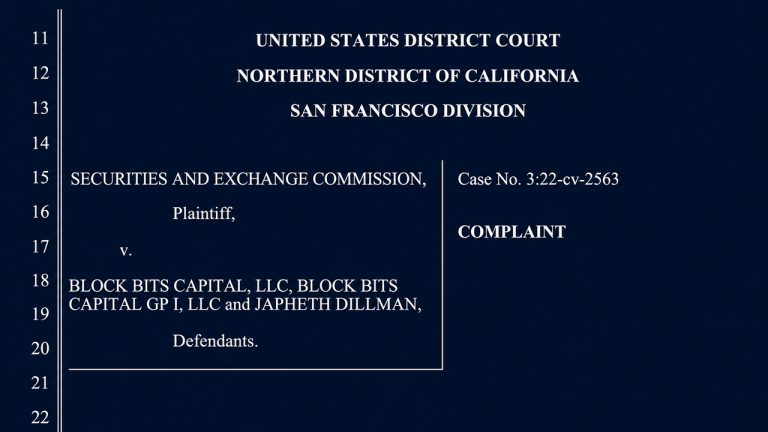
Report: Block Bits Founder Guilty After $960K Crypto Bot Pitch Implodes
A federal jury convicted Block Bits co-founder Japheth Dillman on five fraud-related counts after prosecutors showed how nearly $1 million flowed from investors into a cryptocurrency trading operation built around an automated system that never existed.…

Bessent's Iran Sanctions: Markets Price Limited Teeth Until a Major Bank Gets Hit
Bessent threatened to cut Iran's enablers from the dollar system. Oil fell, Bitcoin rose, and no institution was named. The post Bessent's Iran Sanctions: Markets Price Limited Teeth Until a Major Bank Gets Hit appeared first on BeInCrypto.
Why the Bitcoin Rally Looks Like a Vote Against the Dollar
Bitcoin and gold rose as the dollar weakened following expanded Treasury bond buybacks, reflecting concerns about U.S. fiscal policy, analysts say.